We've got your back
Sterling Trader® Pro Guide
Sterling's user manuals are continuously updated digitally. Explore the step-by-step resources in the product user guides to sharpen your trading & risk management skills.
Sterling's user manuals are continuously updated digitally. Explore the step-by-step resources in the product user guides to sharpen your trading & risk management skills.
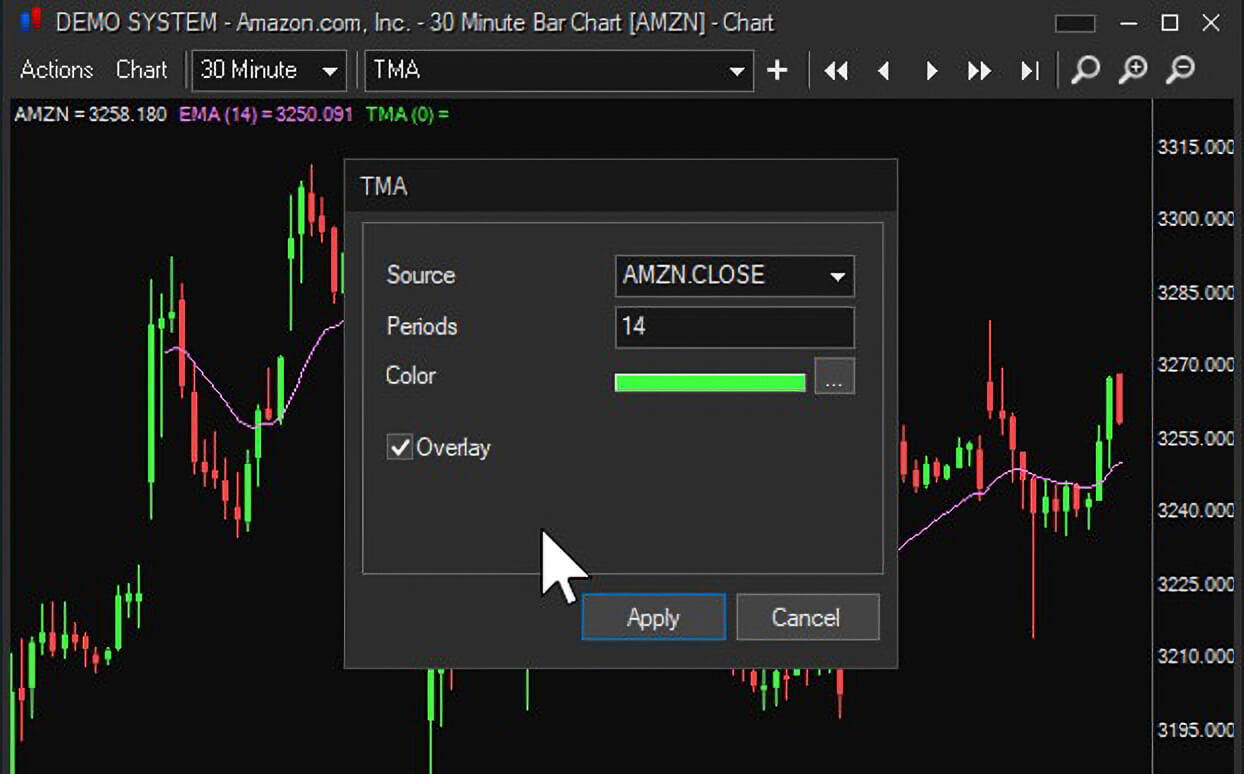
Access the Chart Settings menu by clicking Chart > Settings in a chart window
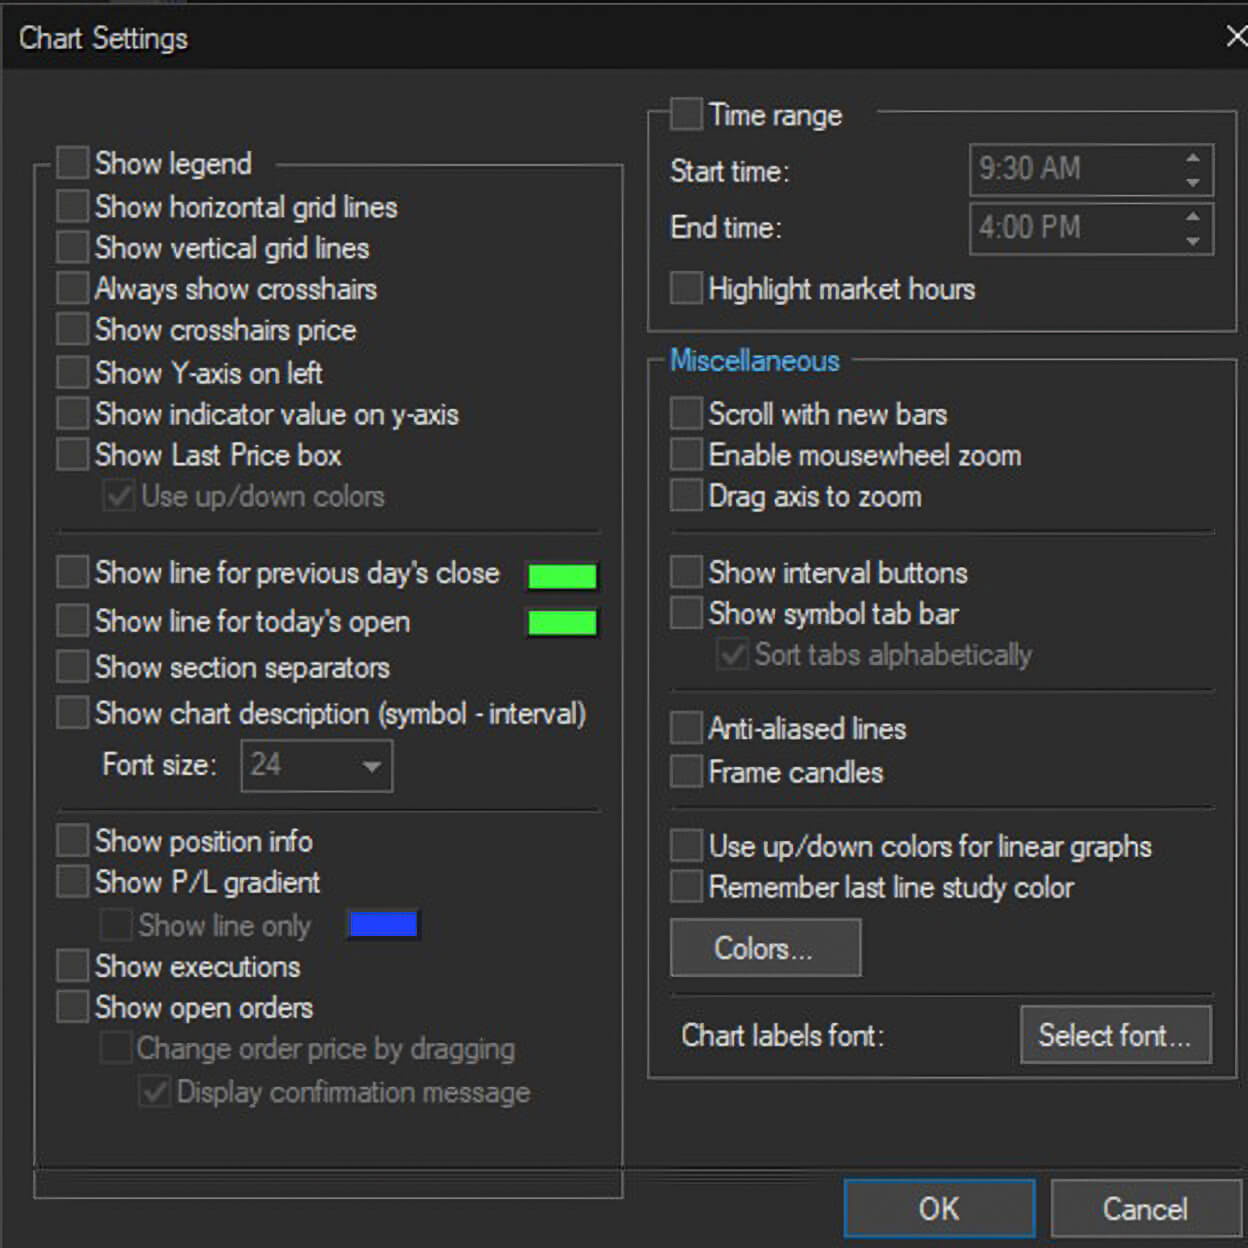
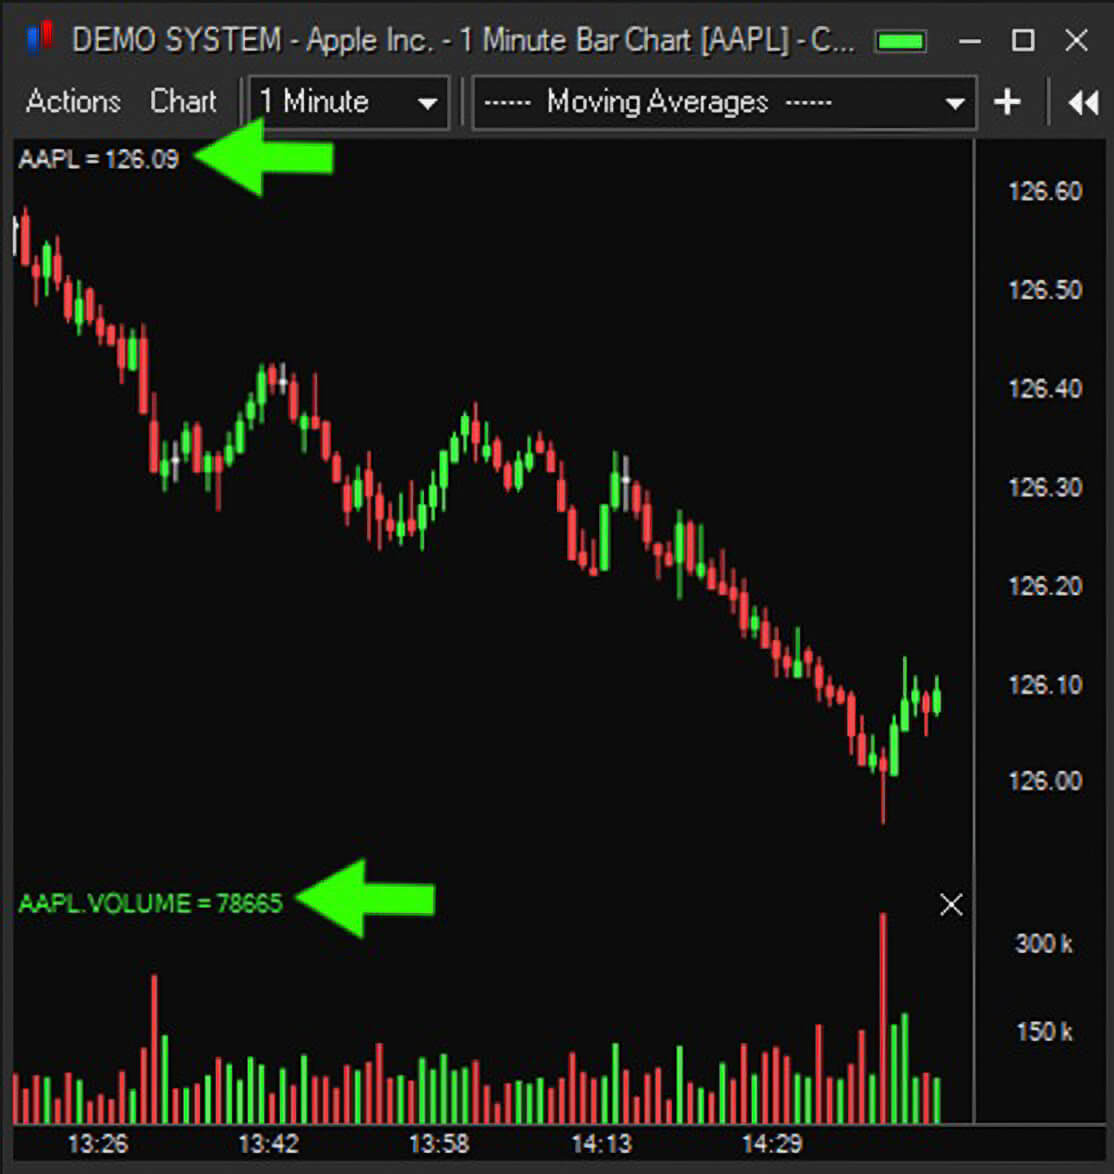
Show Legend – displays the symbol and its current price along with any indicators and their value.
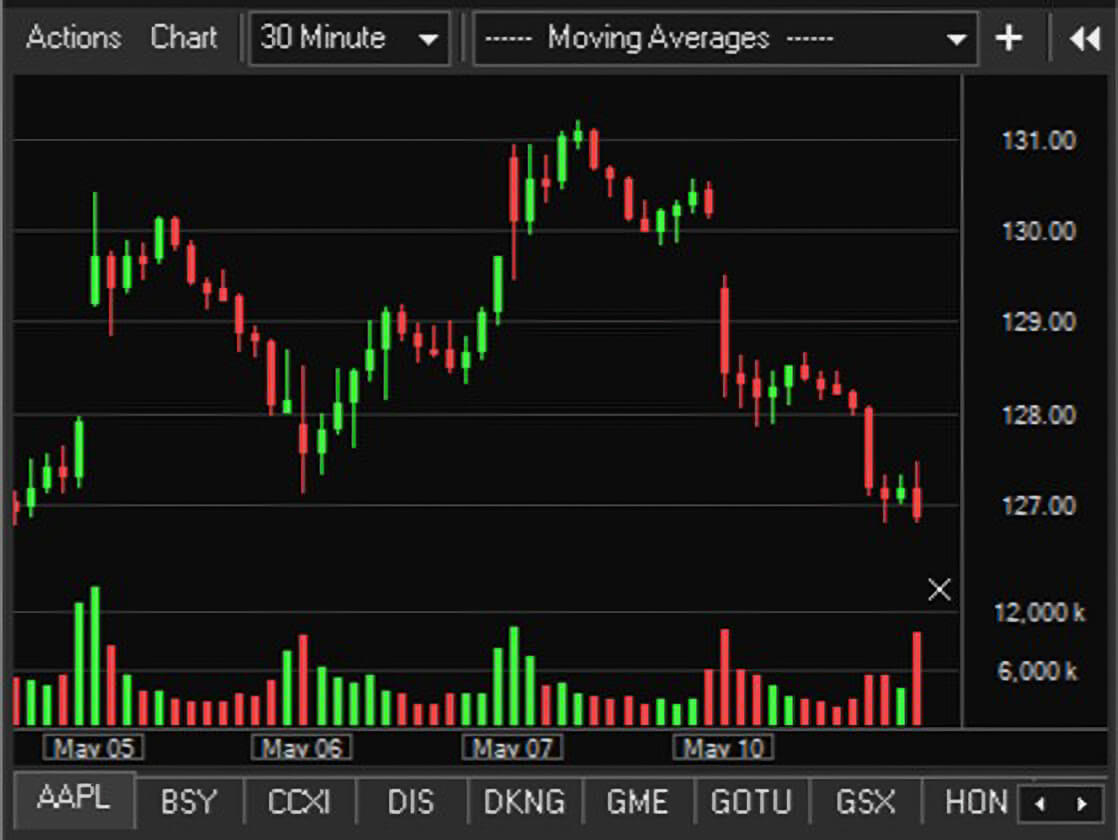
Show horizontal gridlines and Show vertical gridlines – adds horizontal and/or vertical gridlines to the chart.
Always show crosshairs – displays crosshairs at mouse cursor location in the chart.
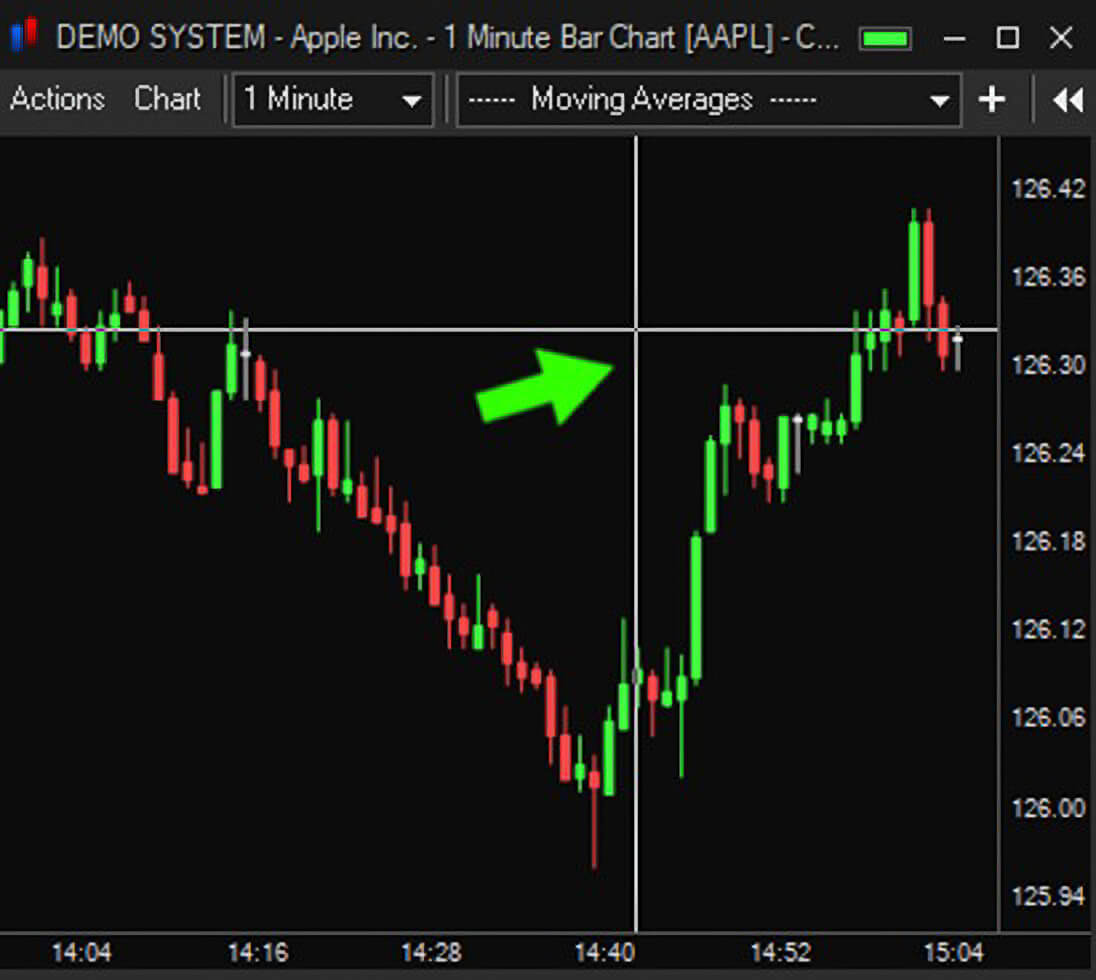
Show crosshairs price – displays price at the crosshairs level.
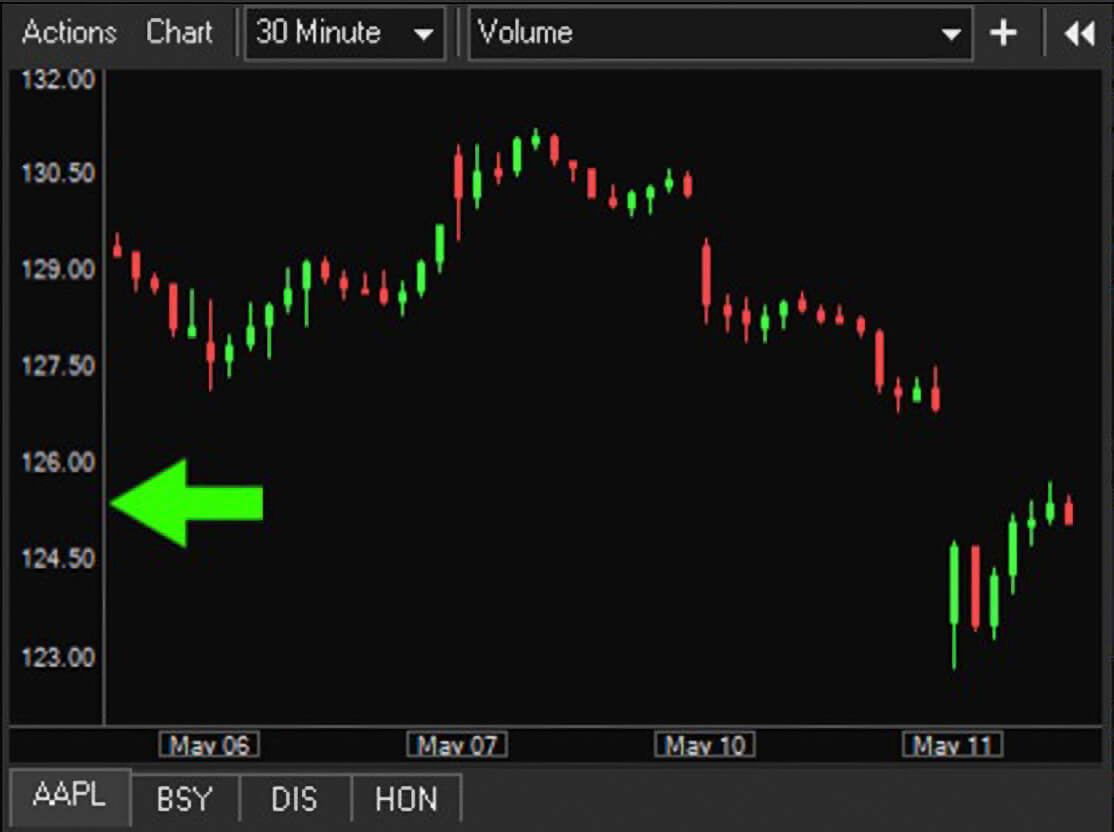
Show Y-axis on left – displays the Y-axis on the left side of the chart.
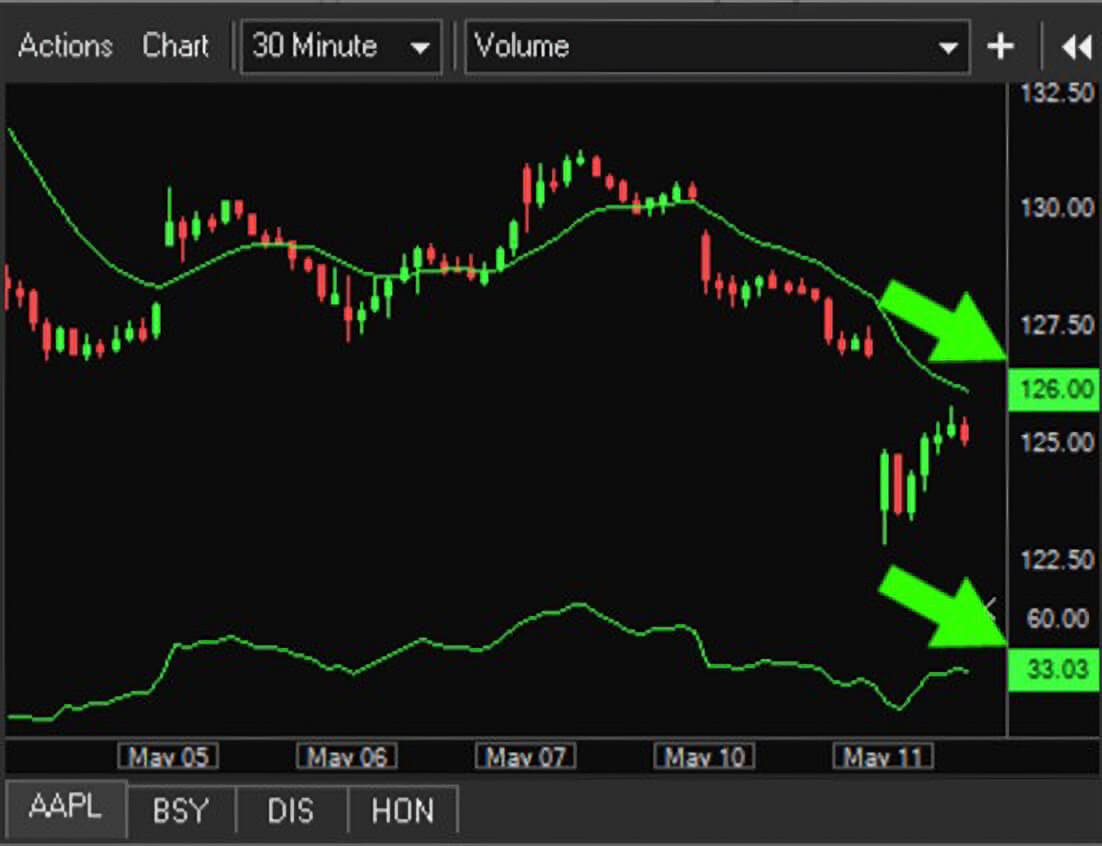
Show indicator value on Y-axis - displays the current value of indicators in a chart.
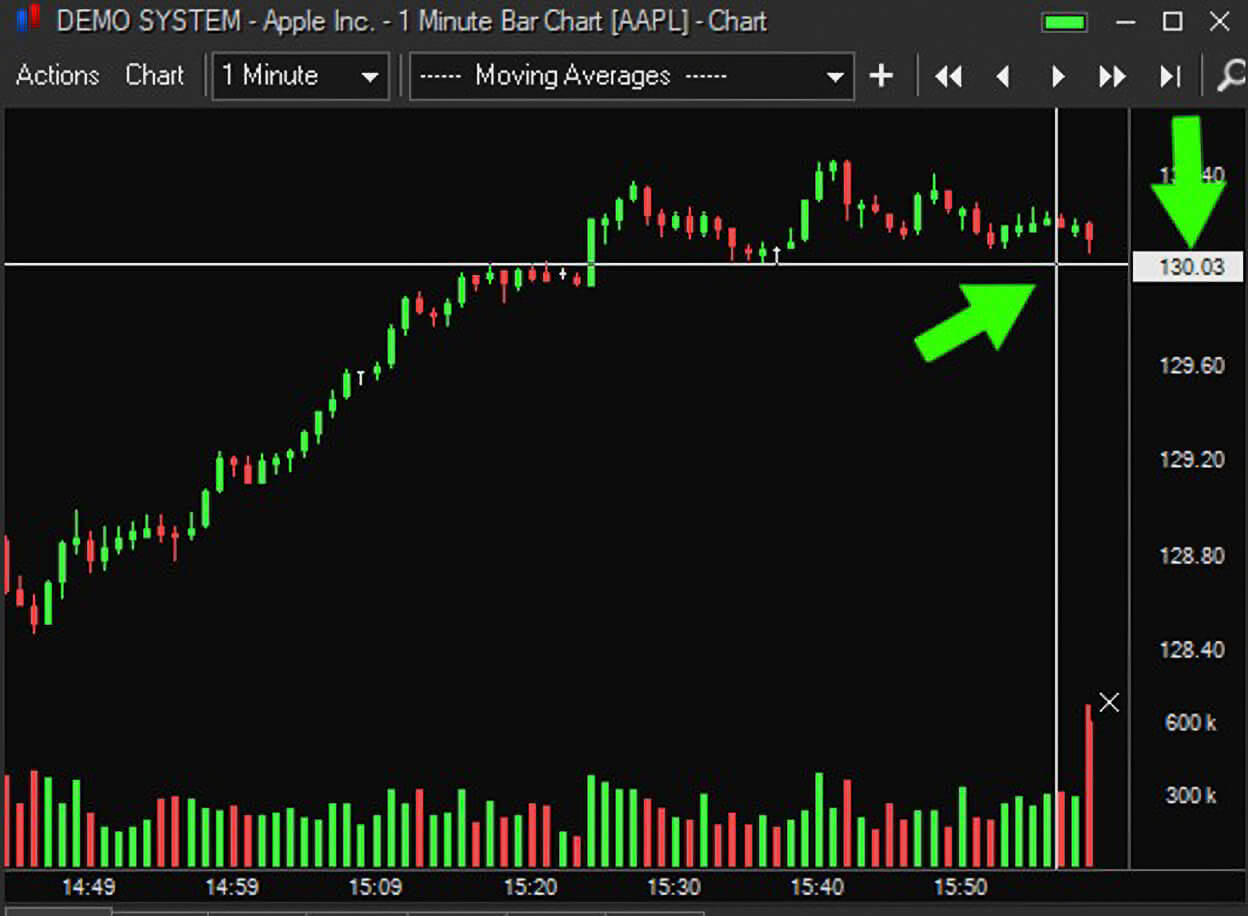
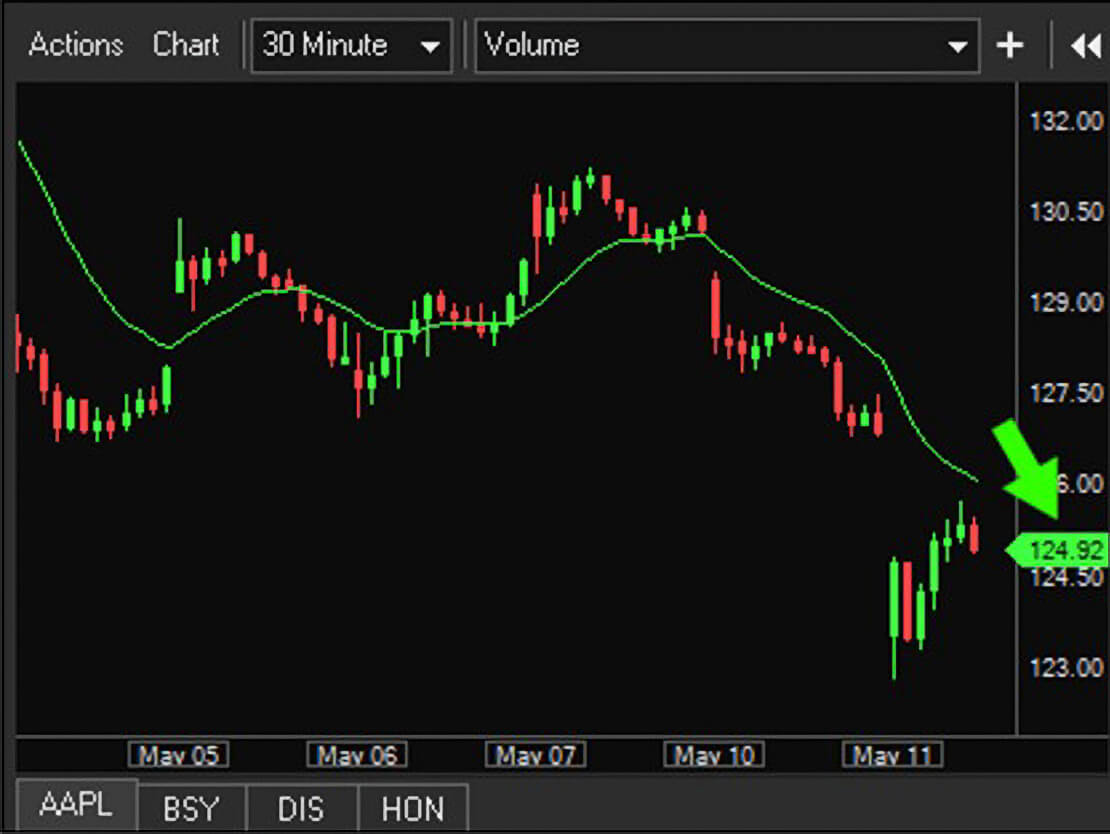
Show Last Price box – displays the last traded price on the Y-axis.
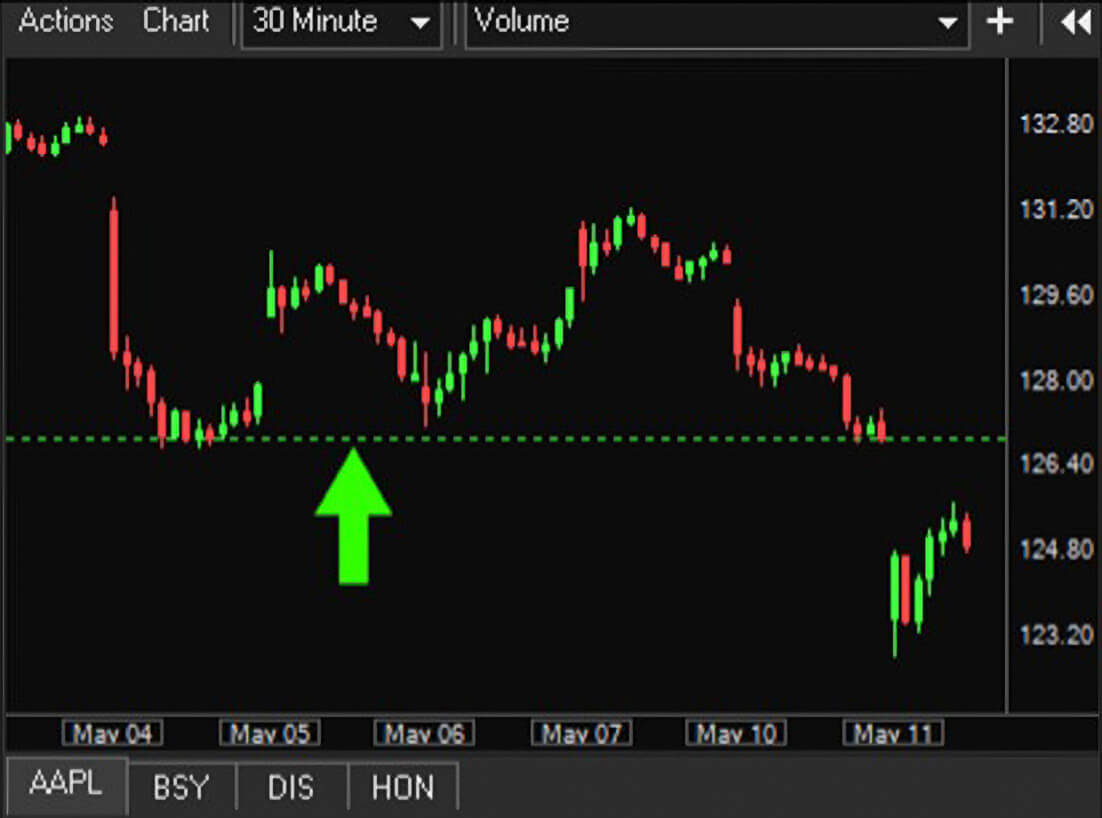
Show line for previous day’s close – displays a dotted horizontal line at the previous close price.
Show line for today’s open - displays a dotted horizontal line at today's open price.
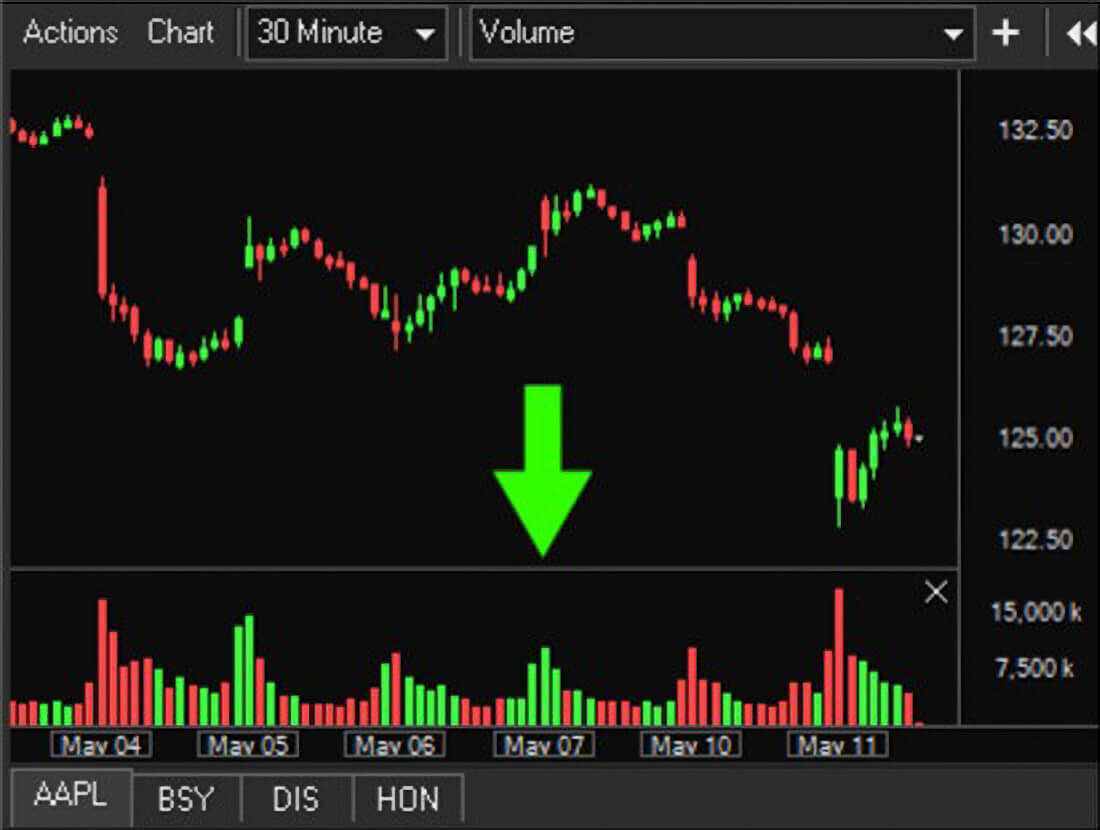
Show section separators – displays a horizontal line separating any indicators in a separate section of the chart.
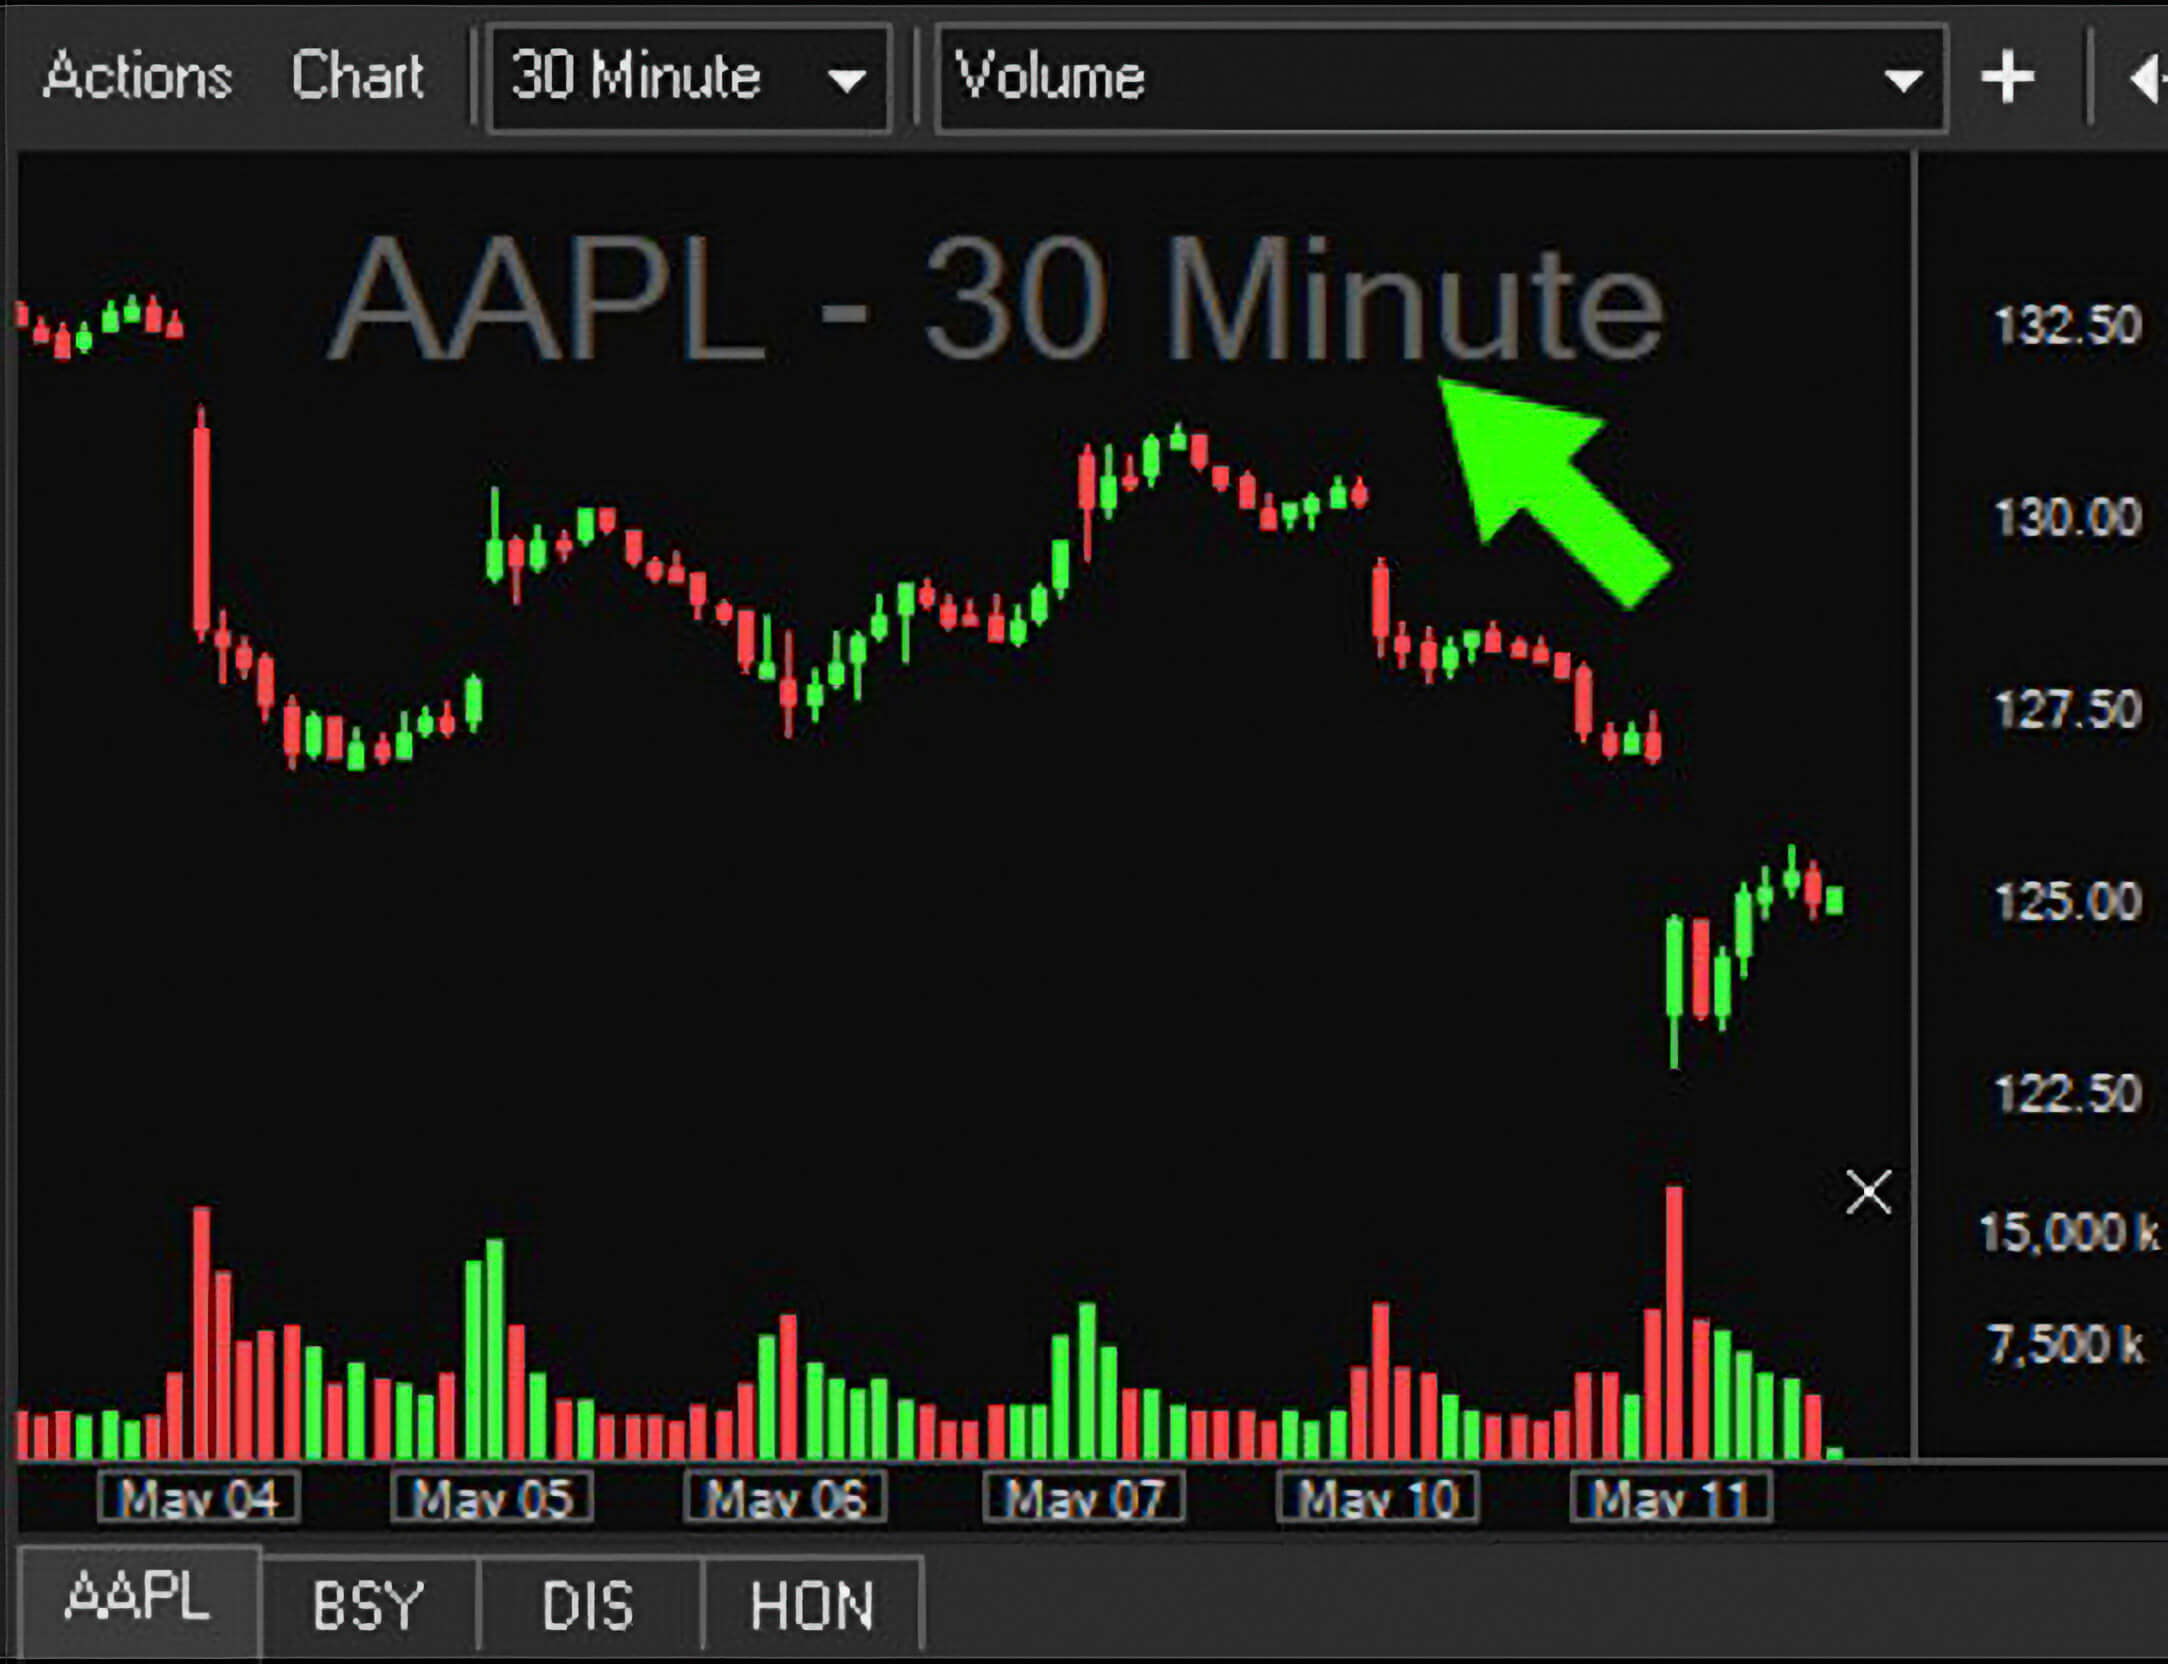
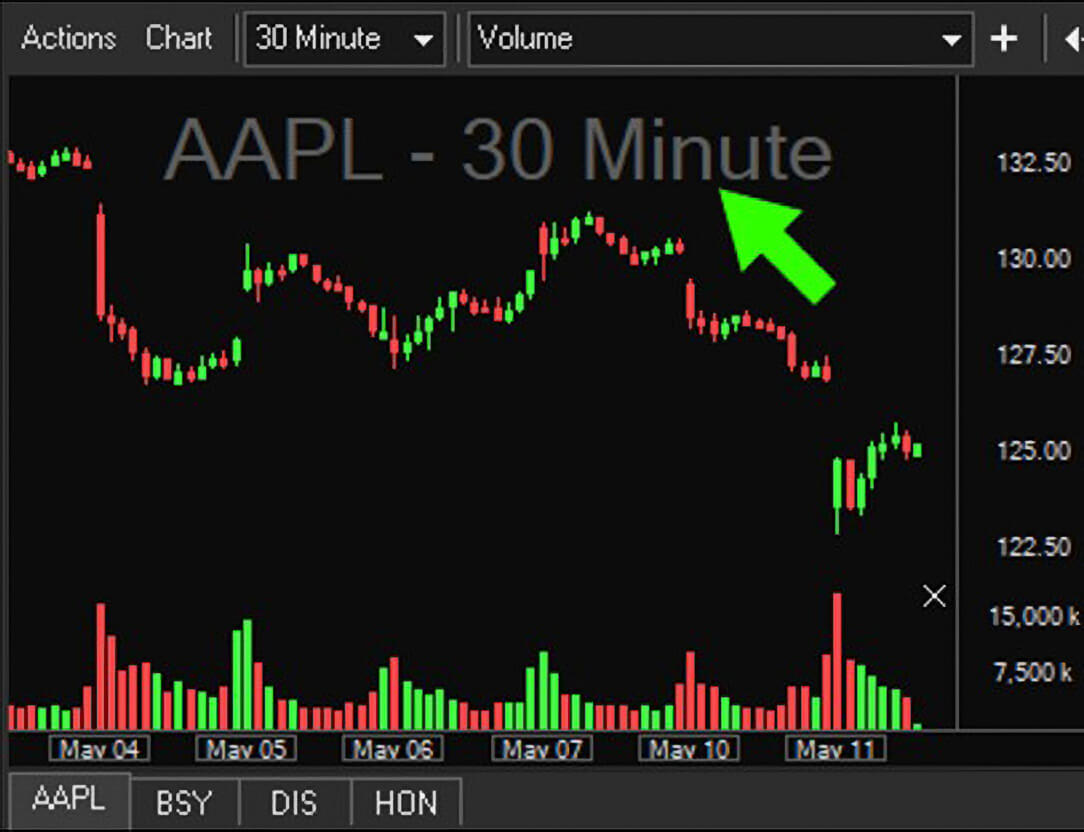
Show chart description (symbol – interval) - displays the chart symbol and time interval.
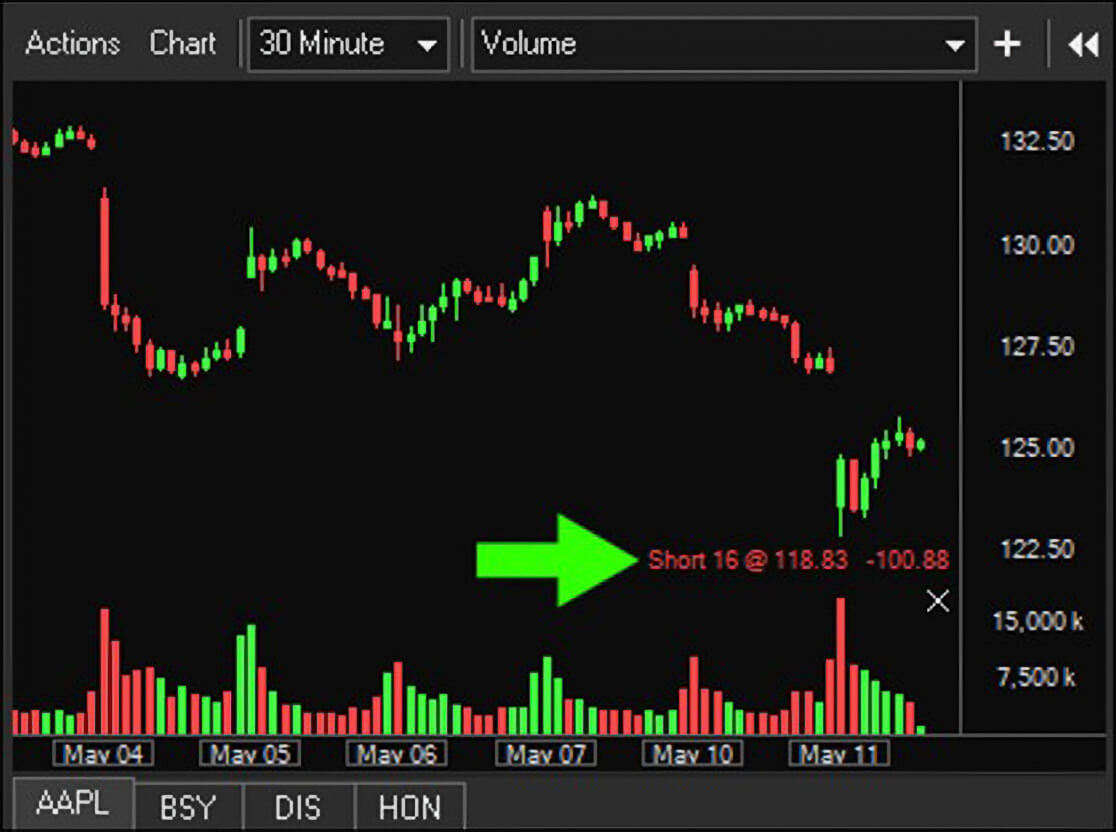
Show position info – displays current position in the symbol along with Total P&L.
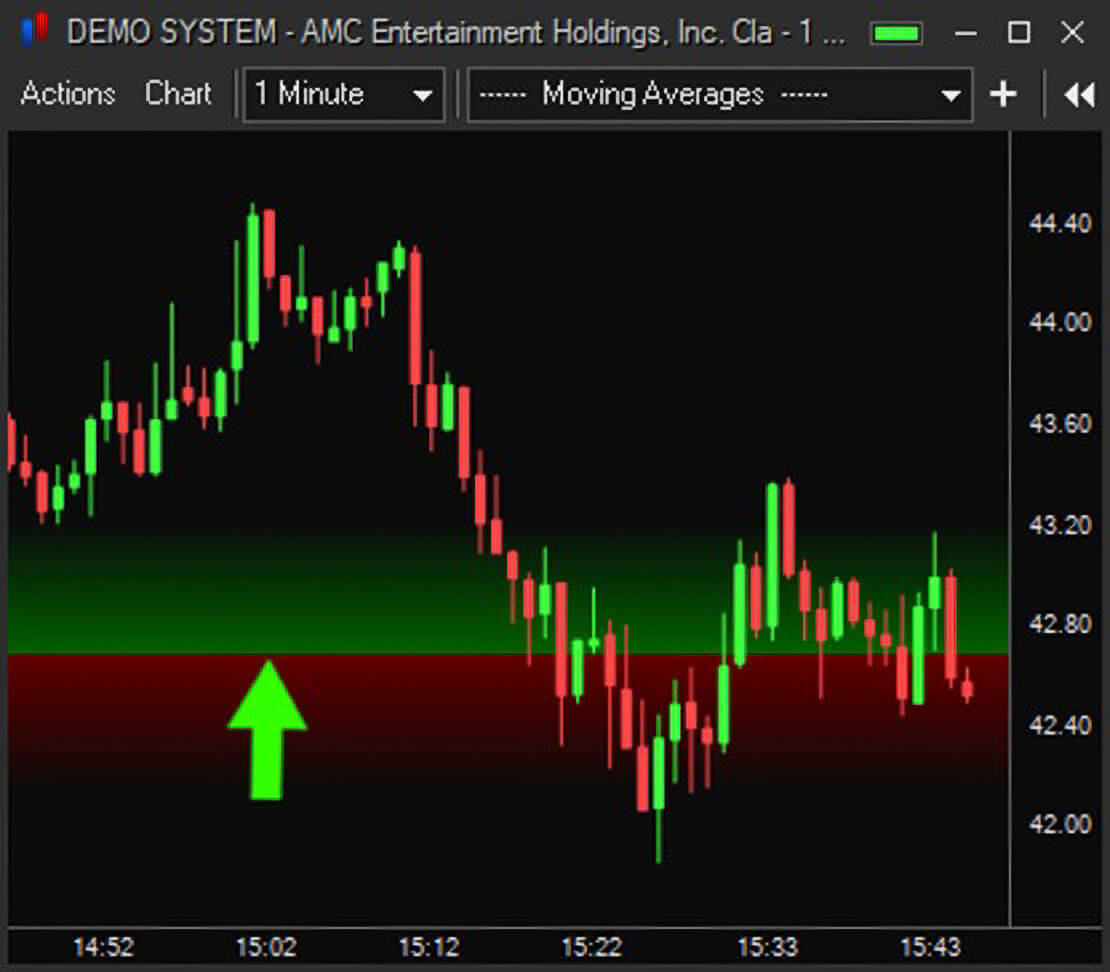
Show P/L gradient – displays a horizontal line at the position average price with a green gradient showing profit and red gradient showing a loss.
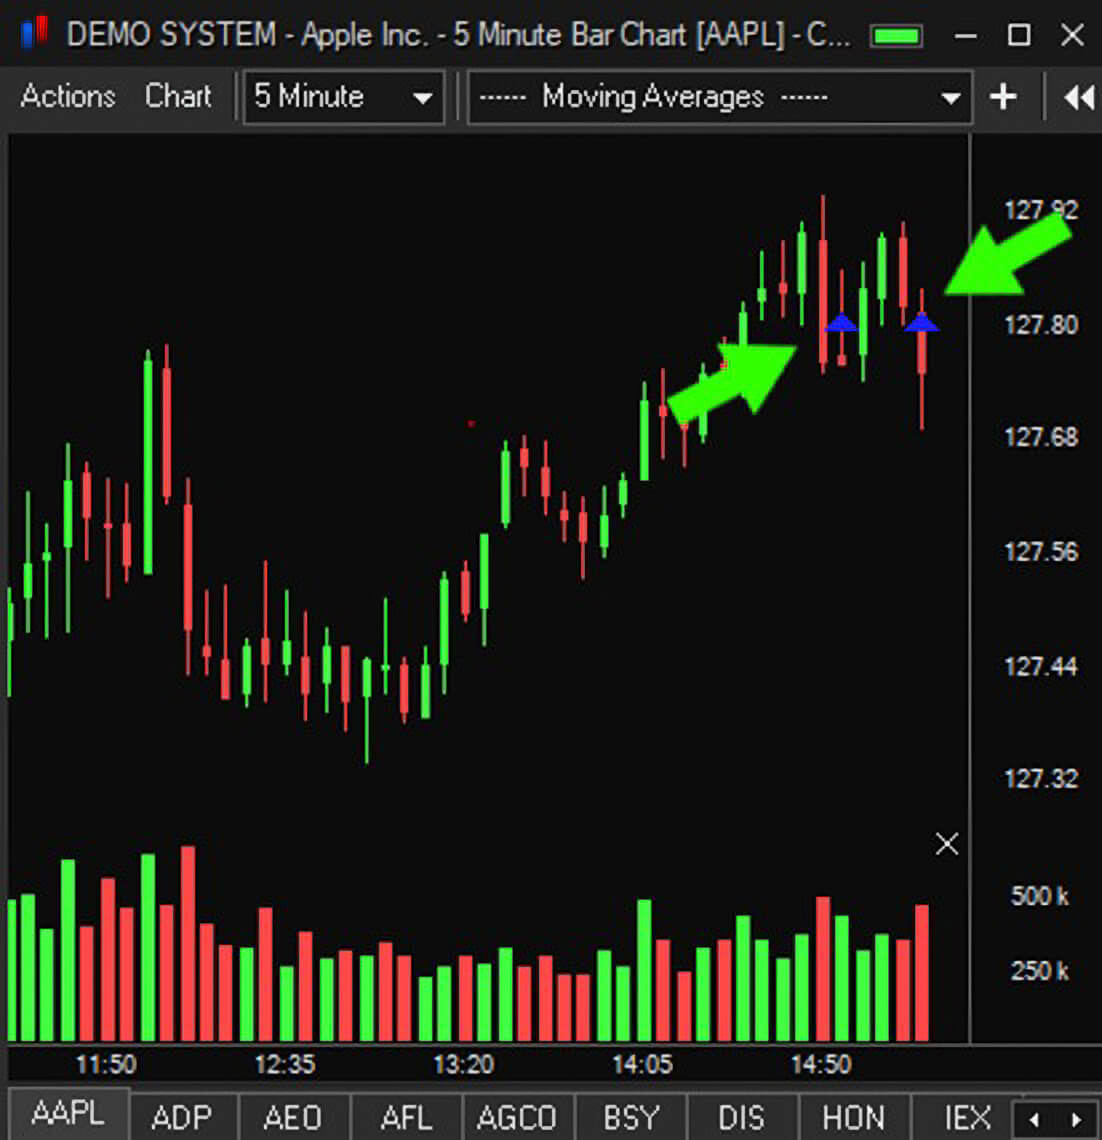
Show executions – displays a blue triangle icon at the execution time and price.
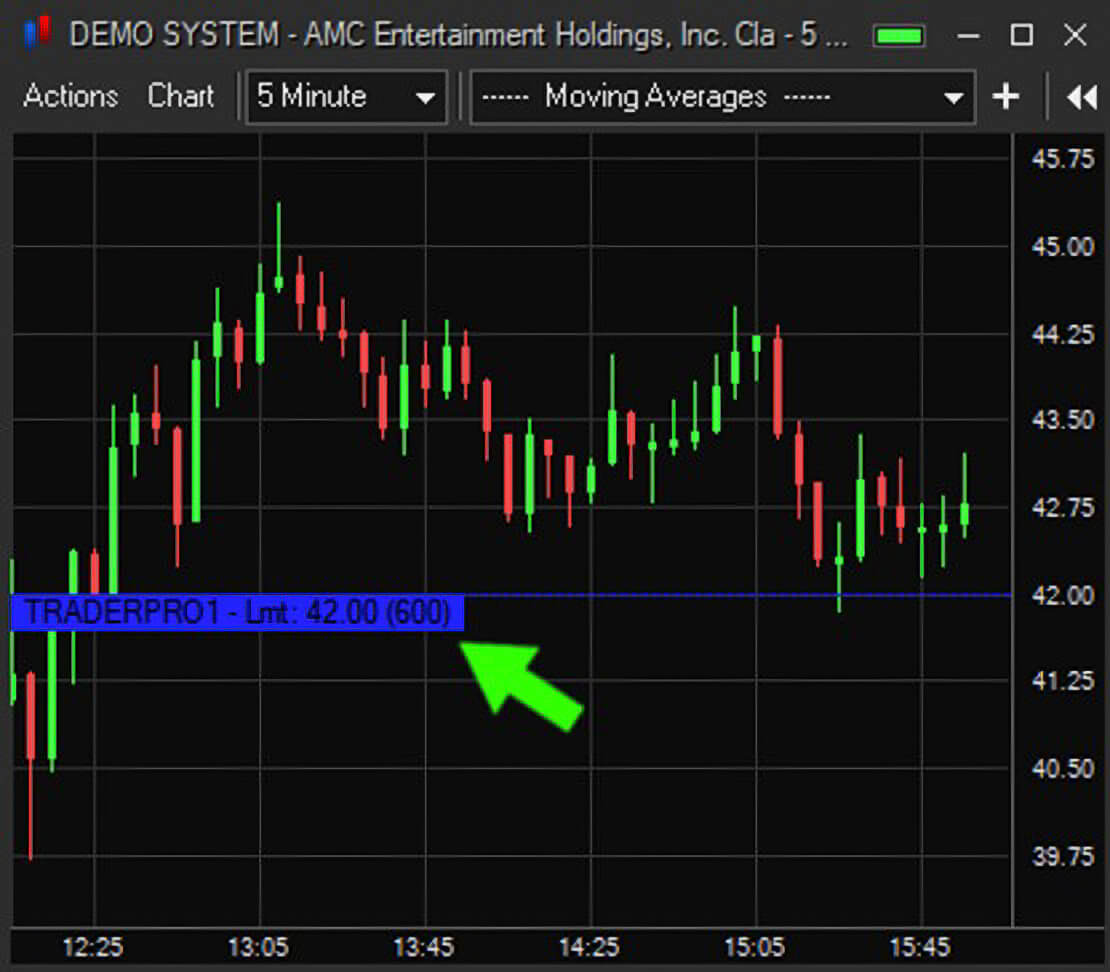
Show open orders – displays a vertical line at the order price level along with a section containing the order details.
Change order price by dragging – enables the ability to left click, drag and drop the open order line to change the order price.
Time range – set a custom time range for the chart. Defaults to regular market hours.
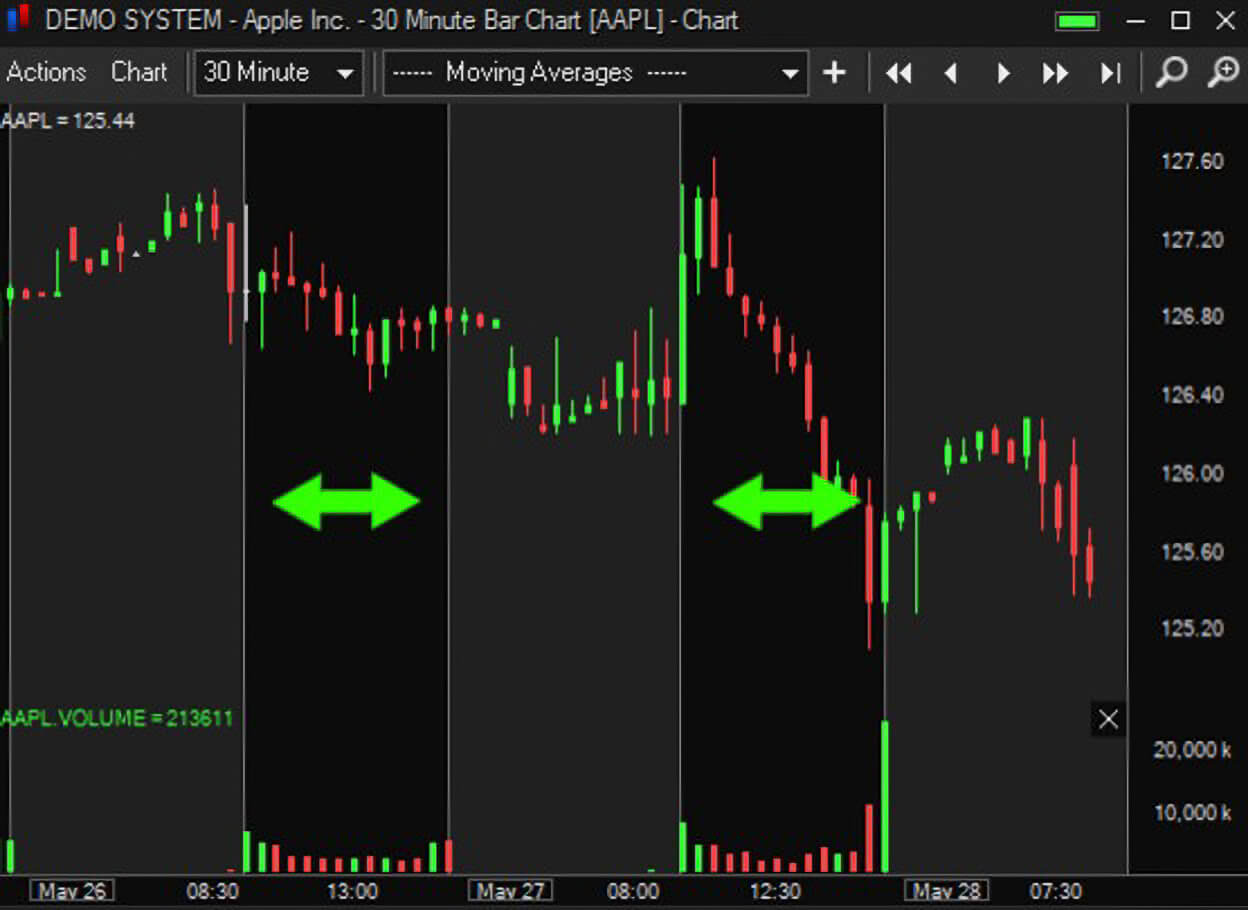
Highlight market hours – highlights market hours in the chart.
Scroll with new bars – when checked, the chart will scroll when new bars are added. When unchecked, new bars will be added but the chart will not scroll.
Enable mousewheel zoom – when the cursor is in the chart, mousewheel forward will zoom in and mousewheel back will zoom out.
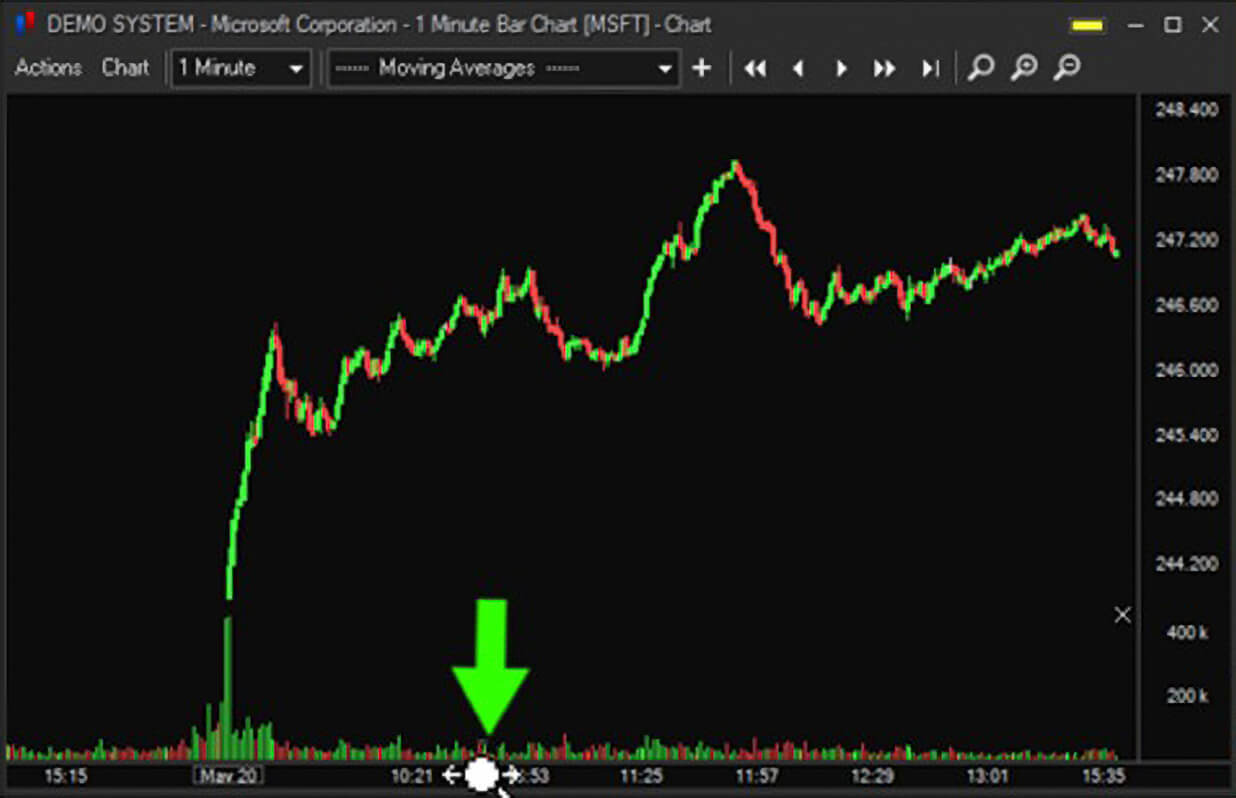
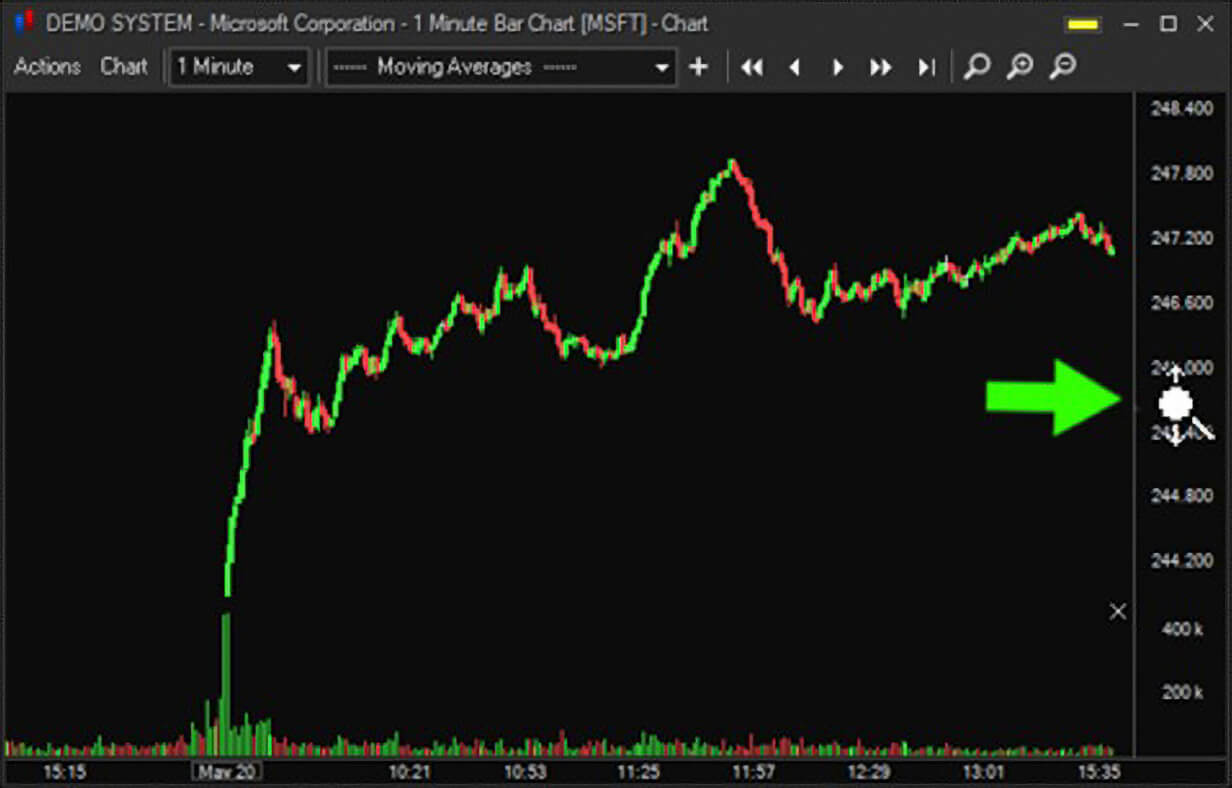
Drag axis to zoom - left click hold and drag will zoom the X or Y axis.
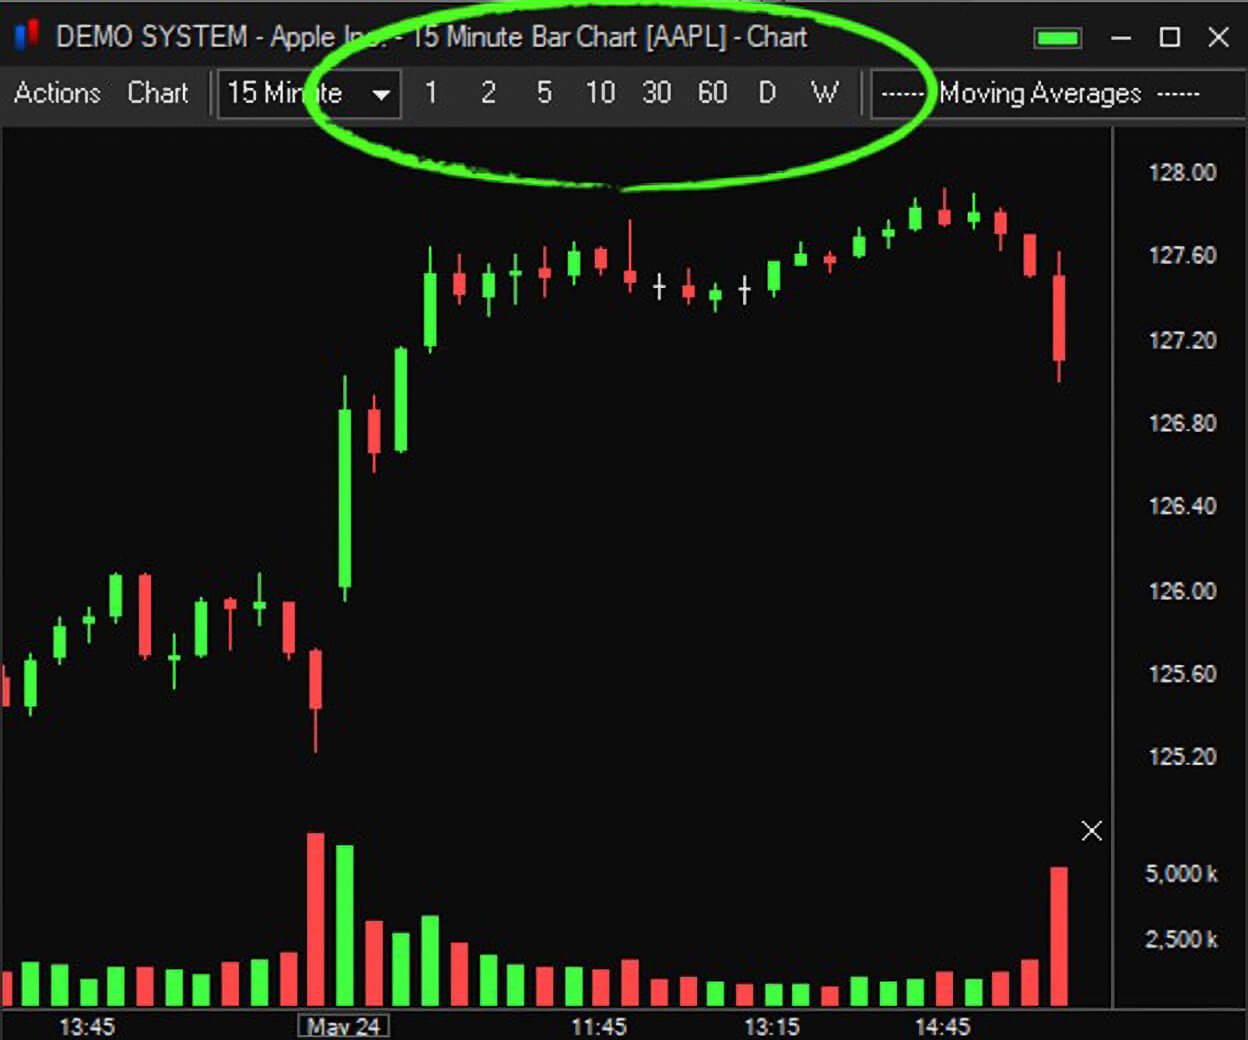
Show interval buttons - display or hide the chart interval buttons.
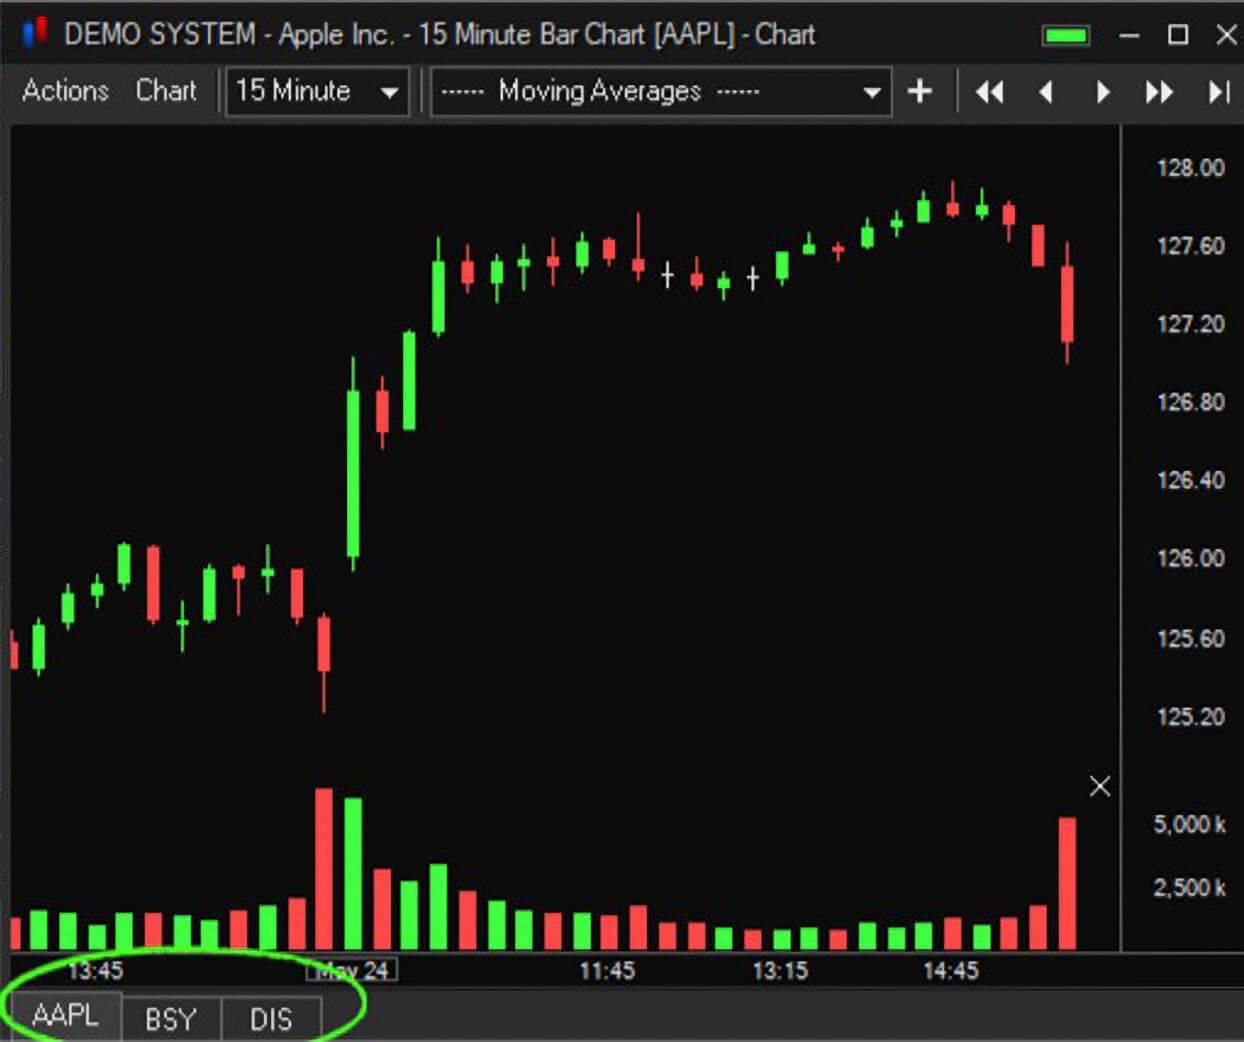
Show symbol tab bar - display or hide the symbol tab bar. Changing the chart symbol will add the new symbol to the tab bar.
Anti-aliased lines - smooths chart lines.
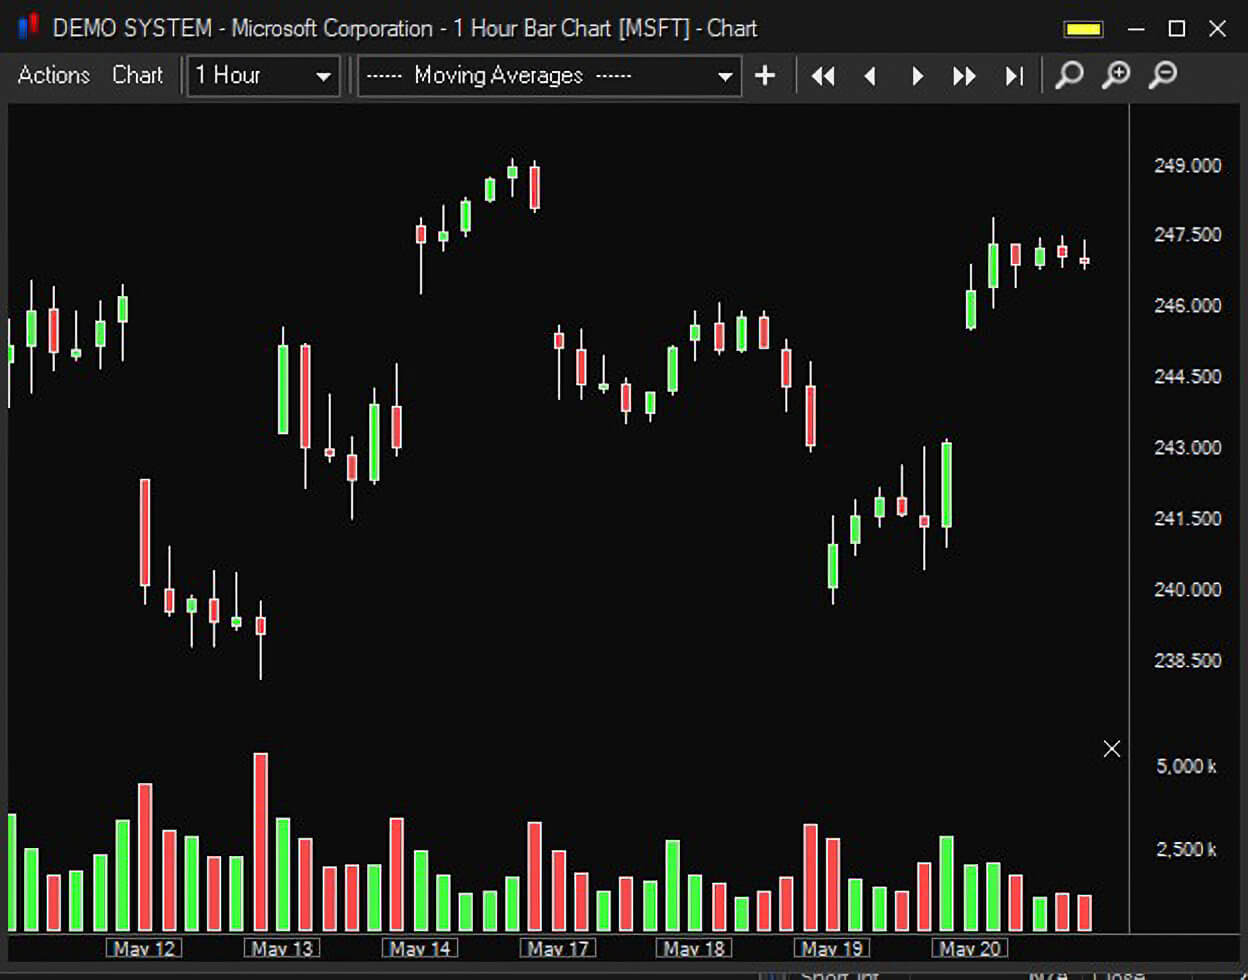
Frame candles - displays a border around each candle.
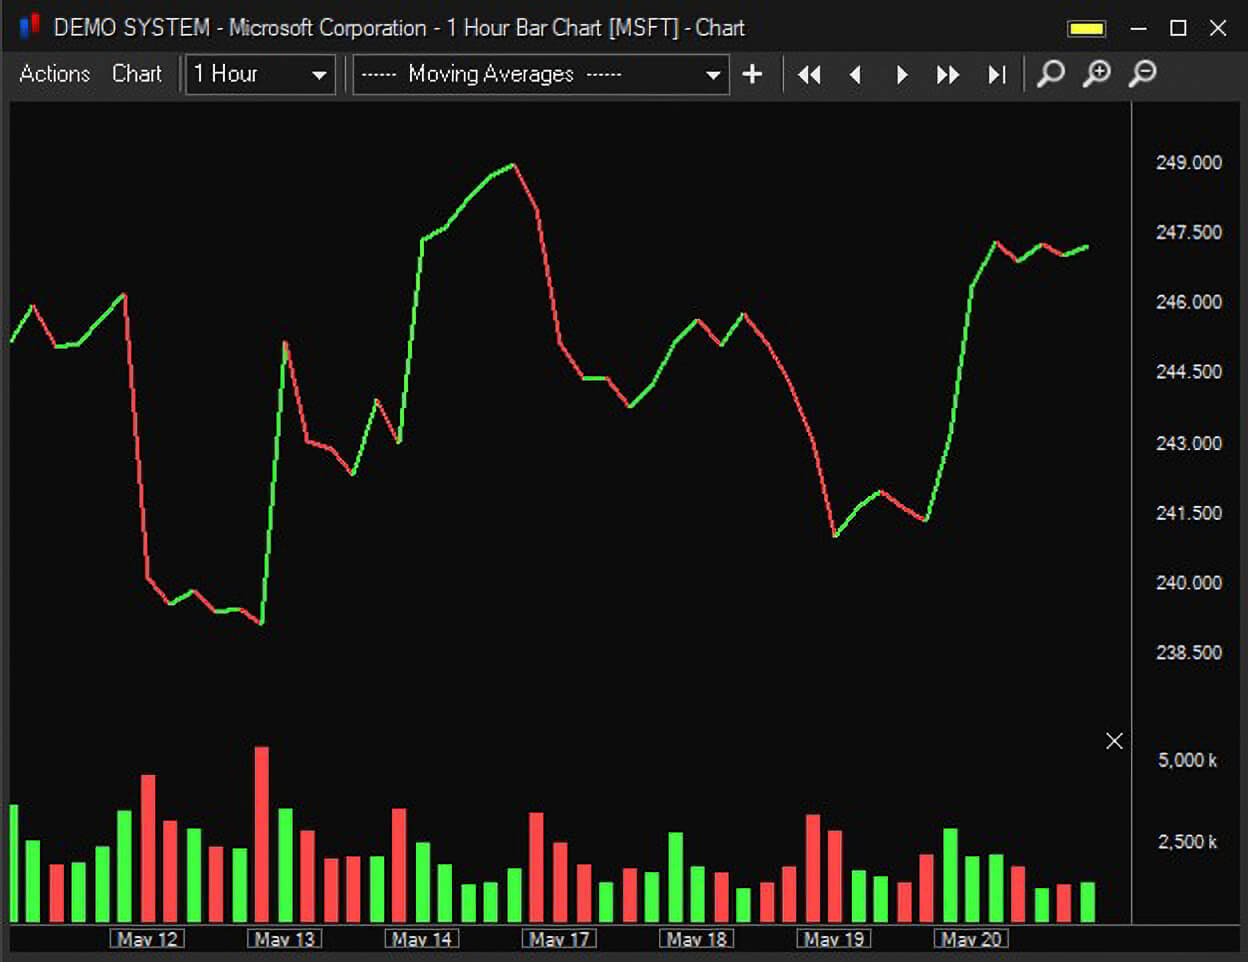
Use up/down colors for linear graphs – chart price moves up will be designated with a green line and moves down with a red line.
Rember last line study color – Applies last used line study color to any new lines studies added.
Colors – adjust the chart colors.
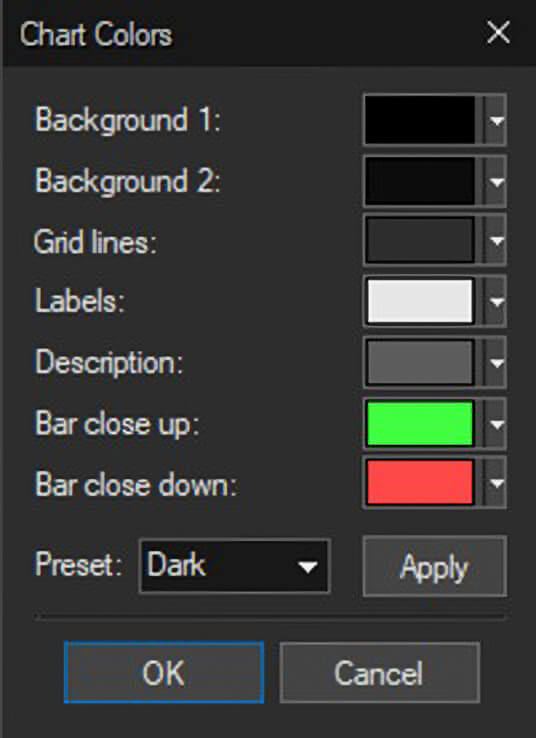
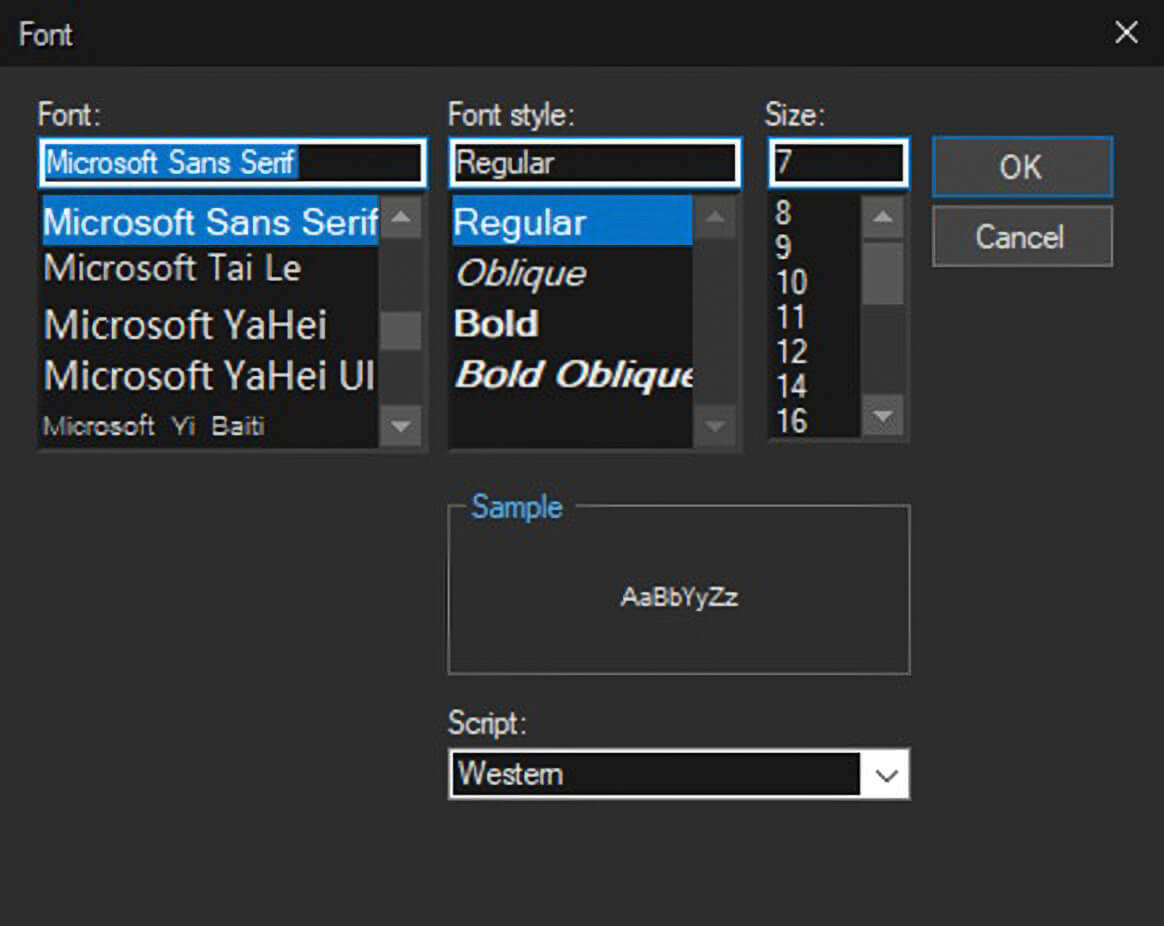
Chart labels font – select the font to use for chart labels.