We've got your back
Sterling Trader® Pro Guide
Sterling's user manuals are continuously updated digitally. Explore the step-by-step resources in the product user guides to sharpen your trading & risk management skills.
Sterling's user manuals are continuously updated digitally. Explore the step-by-step resources in the product user guides to sharpen your trading & risk management skills.
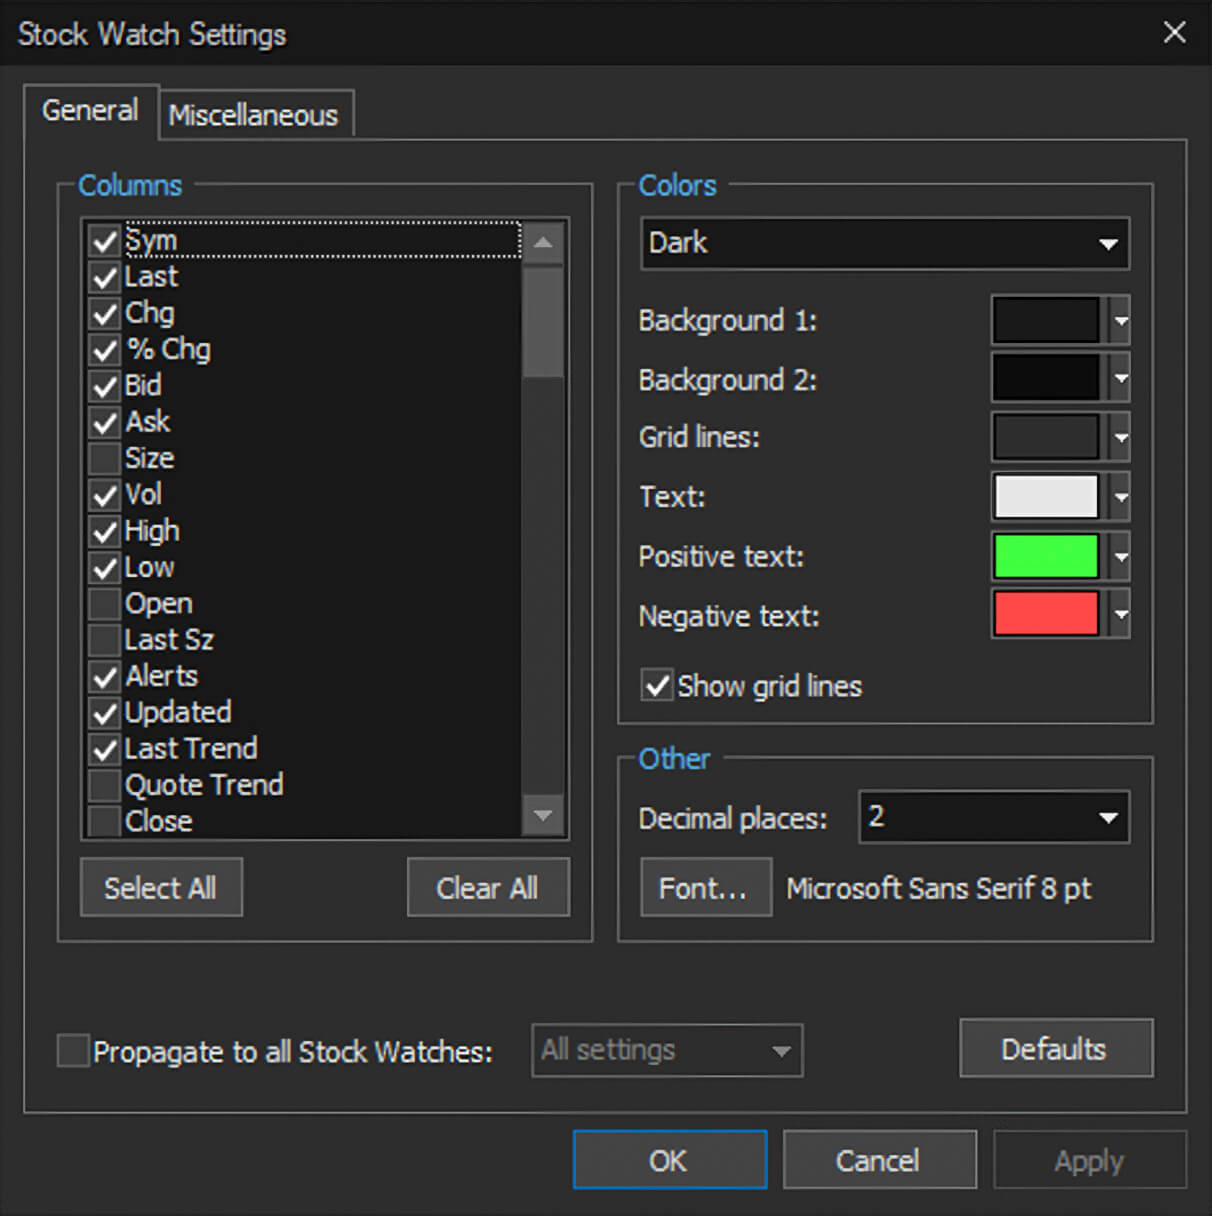
The list of available columns can be found in VIEW > SETTINGS.
Use the check boxes to add to or remove columns from the Stock Watch
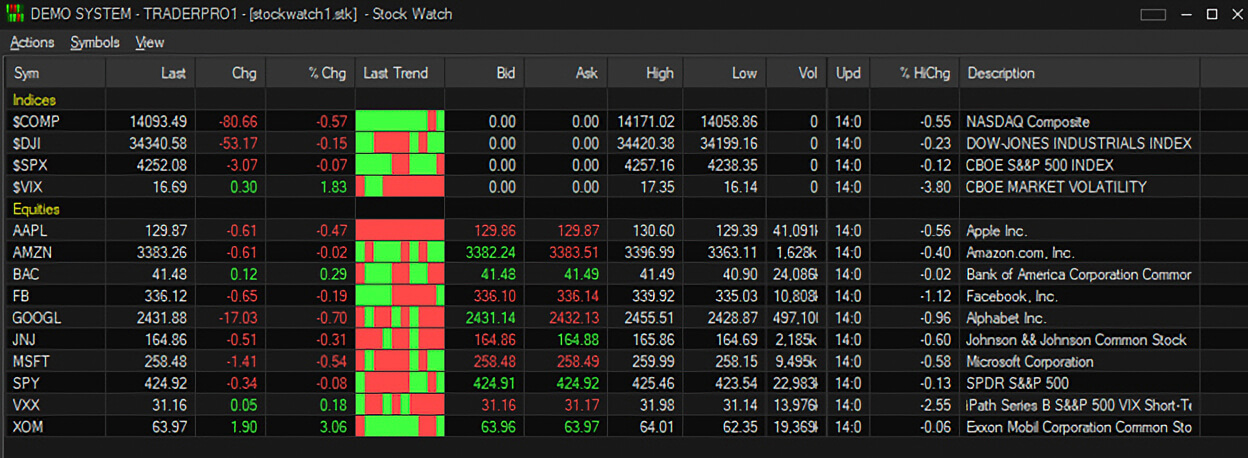
A note on the Last Trend and Quote Trend columns:
Last Trend shows the direction of the last ten trades in a stock, either up, down, or no change from the previous trade price. Up is green, down is red, and no change is the same color as the preceding trend box.
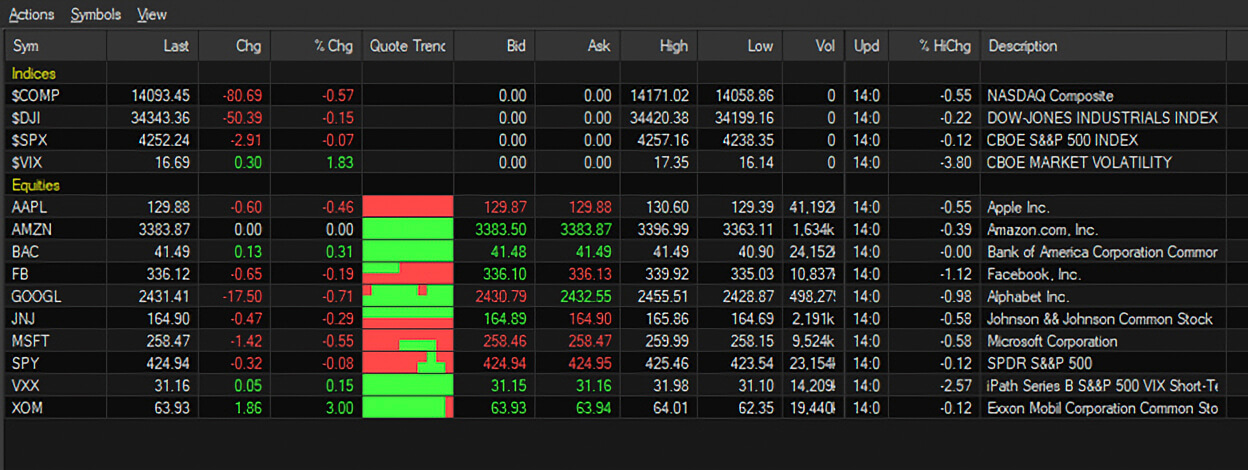
Quote Trend shows the direction of the last ten Bids and the last ten Offers. The indicator boxes are split in two with the top half representing bids and the bottom representing offers. Up price is green, down is red, and “no change” is the same color as the preceding trend box.
Alerts Column – the Alert Legend screenshot below provides descriptions of all alert symbols that can populate the Alerts column. The Alert Legend can also be accessed from the Stock Watch window by clicking View > Alert Legend.
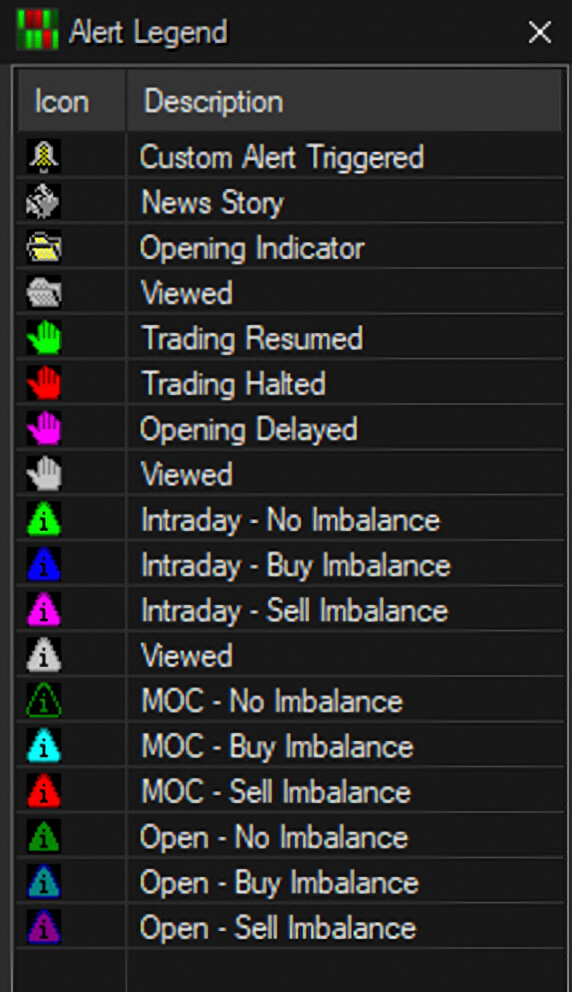
Clicking on an Alert icon in the Stock Watch will open the Exchange Alerts window with details of the alert.
| COLUMN HEADING | DEFINITION |
| SYM | Symbol |
| LAST | Last traded price |
| Chg | Difference between last traded price and previous day’s closing price |
| % Chg | Percentage difference between last traded price and previous day's closing price |
| Bid | Bid |
| Ask | Ask |
| Size | Market size displayed as (Bid Size) x (Ask Size) |
| Vol | Volume traded for the day |
| High | High traded price for the day |
| Low | Low traded price for the day |
| Open | Opening price |
| Last Sz | Last traded size |
| Alerts | Shows triggered custom alerts and exchange alerts |
| Updated | Time of last quote update |
| Last Trend | Shows direction of the last ten trades |
| Quote Trend | Shows direction of the last ten Bids and Offers |
| Close | Previous day’s closing price |
| Cur Imb | Current share imbalance |
| Avg Vol | Average daily volume |
| Spread | Difference between Bid and Ask |
| OpnChg | Difference between last traded price and opening price |
| %OpnChg | Percentage difference between last traded price and opening price |
| Opg Bid | Opening Bid |
| Opg Ask | Opening Ask |
| Bid Sz | Current Bid size |
| Ask Sz | Current Ask size |
| Pos | Position |
| $Real | Realized Profit or Loss |
| $Unreal | Unrealized Profit or Loss |
| $Total P/L | $Unreal + $Real |
| $P/L /Shr | Last traded price - Position average price |
| VWAP | Volume Weighted Average Price |
| Description | Instrument description |
| % Range | Last traded price relative to the range between today’s high and low |
| 52 Hi | 52 Week High |
| 52 Lo | 52 Week Low |
| Delta | Instrument Delta value |
| Gamma | Instrument Gamma value |
| Theta | Instrument Theta value |
| Vega | Instrument Vega value |
| Rho | Instrument Rho value |
| TheoPrice | Theoretical Price |
| ImpVol | Implied Volatility |
| Pos Delta | Position Delta |
| Pos Gamma | Position Gamma |
| HiChg | Difference between daily high and last price |
| %HiChg | Percentage difference between daily high and last price |
| LoChg | Difference between daily low and last price |
| %LoChg | Percentage difference between daily low and last price |
| OpnGap | Difference between previous closing price to opening price |
| %OpnGap | Percentage difference between last traded price and opening price |
| Pos Theta | Position Theta value |
| Underlying | Underlying Symbol |
| B/A Mid | Mid-point between Bid and Ask |
| ExDivDate | Ex-dividend date |
| Fin Vol | Volume * Instrument average price traded today |
| Today Close | Today's closing price |
| Today Chg | Difference between last traded price and today's closing price |
| Today % Chg | Percentage difference between last traded price and today's closing price |